Pitch is the perceived frequency of a sound.
Pitch and frequency are used interchangeably throughout the guide. The subtle difference between the two is that pitch is a subjective perception of the frequency of a sound whereas frequency is an objective physical property of a sound.
Sound occupies a range of frequencies called the sound spectrum. A spectrogram provides a visual representation of the spectrum.
Sound is broken down in the guide into two broad groups: pitched sound, commonly called a note, and unpitched sound.
A quick way to determine whether a sound is pitched or unpitched is to try to sing it. If you can sing it, it is pitched sound, if you cannot, it is unpitched. For example, you may, with some effort, sing like a bird. Birdsong is pitched sound. You cannot sing like a waterfall, it is unpitched sound.
Audio: spectrum (0:08)

| Band | Range | Min (Hz) | Max (Hz) |
|---|---|---|---|
| Subaudio | O | 20 | |
| Audio | Low | 20 | 160 |
| Mid | 160 | 2560 | |
| High | 2560 | 20000 | |
| Ultrasound | 20000 | 100000+ |
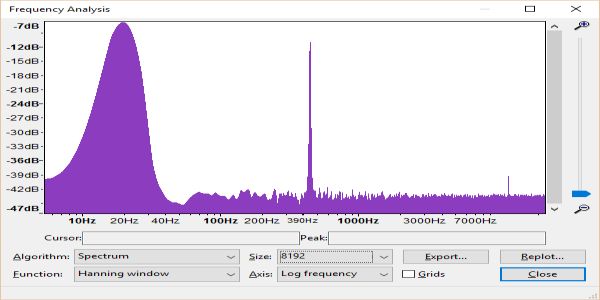
spectrum plays four different sounds in succession. The spectrum figure shows a composite spectrogram of all four sounds:
The spectrum table lists the frequency bands and ranges in the sound spectrum. There are three bands in the spectrum:
The spectrum of sound is similar to the spectrum of light except it covers frequency instead of colour.
Music writing is naturally concerned with sound that can be heard. Audio spans a range from around 20Hz to 20,000Hz (20kHz). Sound outside the audible spectrum is either very low-frequency subaudio or very high-frequency ultrasound. Even though subaudio and ultrasound cannot be heard, they are physical waves, and their effect can be felt.
Audio: spectrogram (0:04)

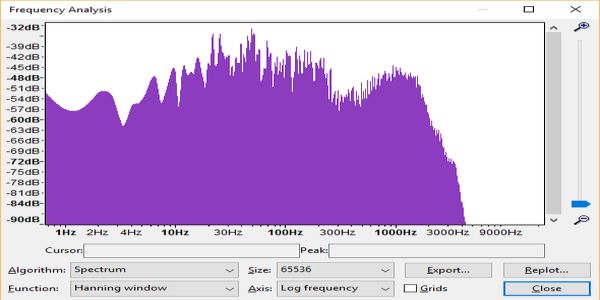
spectrogram plays the sound of wind. The spectrogram figure shows that it is mainly low frequency noise.
A spectrogram is a visual representation of the frequencies present in a sound.
There are many formats for a spectrogram. A two-dimensional graph is used throughout the guide. The vertical dimension represents the amplitude of the sound, how loud or soft it is. The horizontal dimension represents frequency and shows the range of frequencies that make up that sound. Amplitude is measured in decibels and frequency is measured in Hertz.
Spectrum analysis, or frequency analysis, is a process for determining the frequencies present in a sound. It is a useful tool for working out the frequencies present in a piece of music. Some music programmes and apps have a built-in spectrum analyser.
A spectrogram and a waveform both provide visual information about a sound. The difference is that a spectrogram shows the relationship between amplitude and frequency whilst a waveform shows the relationship between amplitude and time.
Audio: note (0:02)

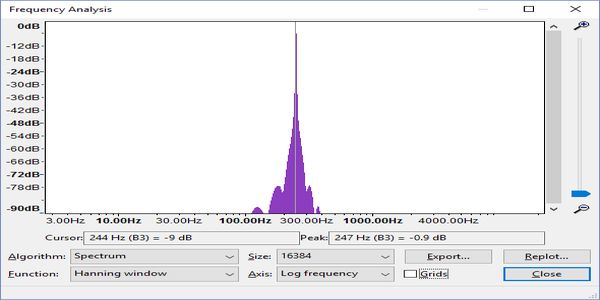
note plays a note with a frequency of 246.942Hz. The note figure shows its spectrogram.
A note or tone is pitched sound.
Melody and harmony contain notes and are the prime examples of pitched sound. Noise and rhythm do not contain notes and are unpitched sound.
A sine wave is the only sound that contains a single frequency. Every other sound contains multiple frequencies. If one of those frequencies is perceived as dominant, louder than rest, it is pitched sound. Unpitched sound has no dominant frequency.
Audio: unpitched sound (0:02)

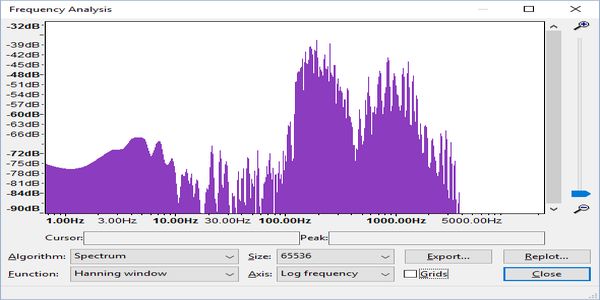
unpitched sound plays unpitched sound. The unpitched sound figure shows its spectrogram.
Unpitched sound is sound in which no single frequency is perceived to be dominant.
Unpitched sound does not contain notes.
Noise and rhythm are the prime examples of unpitched sound.
There is no system for classifying unpitched sound. Sometimes, the only distinction that can be made is between low and high frequency bass and treble. Sometimes a description is added such as low-frequency rumble and high-frequency hiss. The rest of the time it is an exercise in creativity and imagination. unpitched sound is officially designated as the sound of a starship.